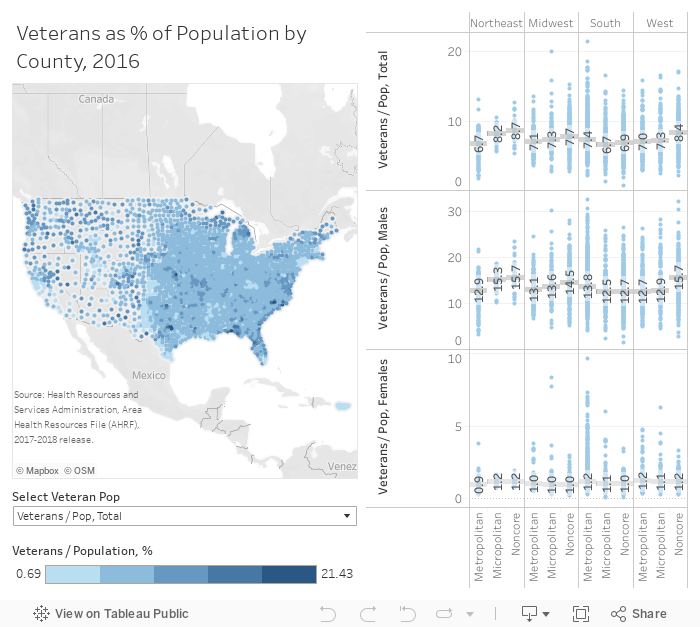
Veterans make up over 8% of the total population but they are distributed unevenly across the Nation. The highest proportions are in the most rural (noncore) counties of the Northeast and West where male Veterans make up over 15% of the male population. Female Veterans are more evenly distributed and make up about 1% of the female population in all census regions and levels of urbanicity.
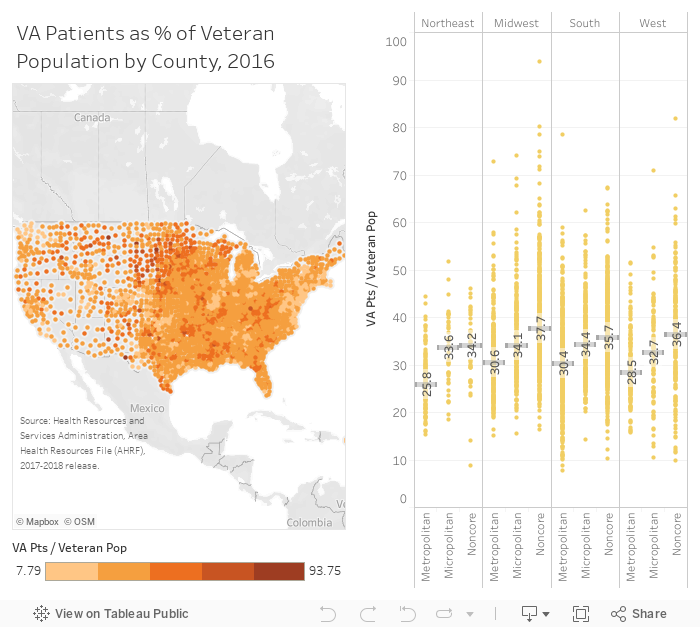
Over 35% of Veterans in the most rural (noncore) counties of the Midwest, South, and West receive care from VHA compared with <30% of Veterans in metropolitan counties of the Northeast and West.
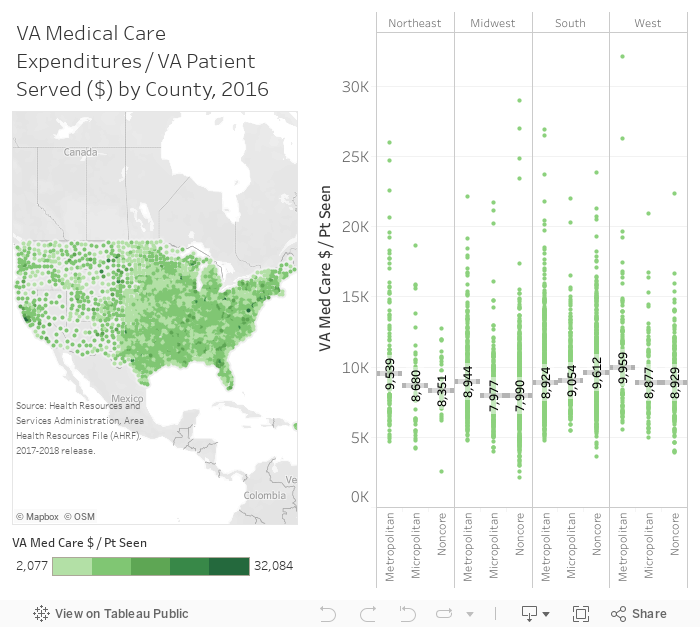
VHA medical care expenditures per Veteran served are highest in metropolitan counties of the West and the most rural (noncore) counties of the South. VHA expenditures are lowest in small town (micropolitan) and the most rural (noncore) counties of the Midwest.
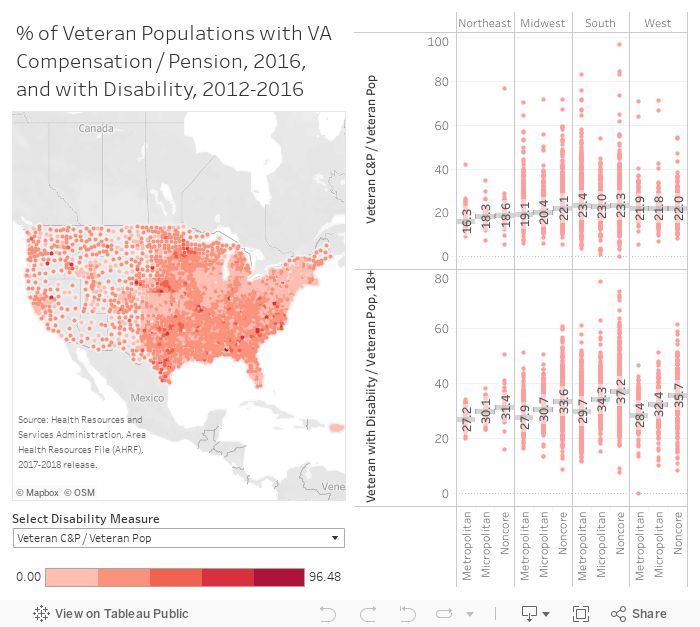
The highest proportion of Veterans receiving disability compensation or pensions are located in the South. The highest proportion of Veterans who are disabled are located in the most rural (noncore) counties of the South and West.
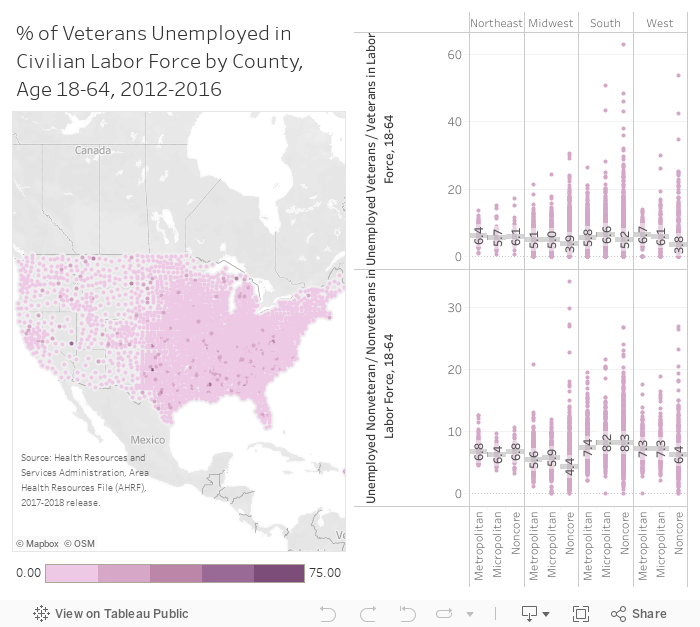
Among Veterans in the civilian labor force, the proportion who are unemployed in highest in metropolitan counties of the West and small town (micropolitan) couties of the South. Among Nonveterans, the proportion who are unemployed is highest in metropolitan, micropolitan, and noncore counties of the South. Overall, in 64% of counties, Nonveteran unemployment is higher than Veteran unemployment.
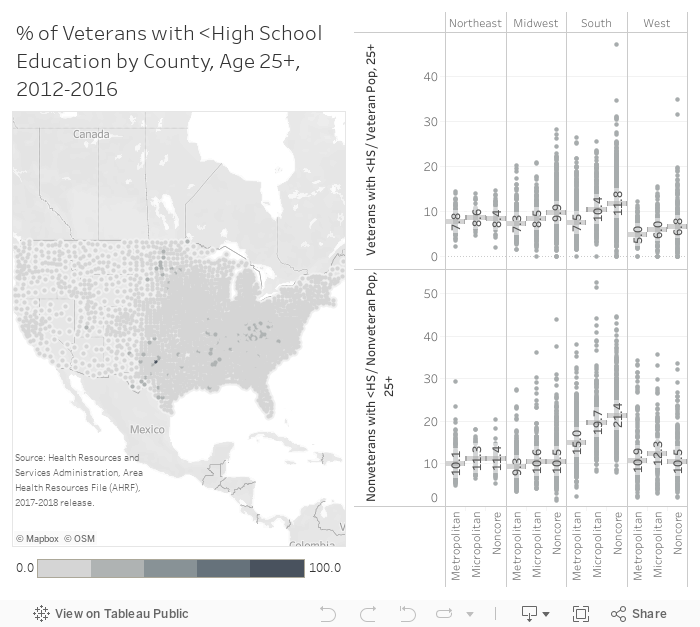
The highest proportion of Veterans and Nonveterans with less than a high school education are in small town (micropolitan) and the most rural (noncore) counties of the South. Overall, in 84% of counties, the proportion of Nonveterans is higher than the proportion of Veterans with less than a high school education.
Over 35% of Veterans in the most rural (noncore) counties of the Midwest, South, and West receive care from VHA compared with <30% of Veterans in metropolitan counties of the Northeast and West.
VHA medical care expenditures per Veteran served are highest in metropolitan counties of the West and the most rural (noncore) counties of the South. VHA expenditures are lowest in small town (micropolitan) and the most rural (noncore) counties of the Midwest.
The highest proportion of Veterans receiving disability compensation or pensions are located in the South. The highest proportion of Veterans who are disabled are located in the most rural (noncore) counties of the South and West.
Among Veterans in the civilian labor force, the proportion who are unemployed in highest in metropolitan counties of the West and small town (micropolitan) couties of the South. Among Nonveterans, the proportion who are unemployed is highest in metropolitan, micropolitan, and noncore counties of the South. Overall, in 64% of counties, Nonveteran unemployment is higher than Veteran unemployment.
The highest proportion of Veterans and Nonveterans with less than a high school education are in small town (micropolitan) and the most rural (noncore) counties of the South. Overall, in 84% of counties, the proportion of Nonveterans is higher than the proportion of Veterans with less than a high school education.
The highest proportion of Veterans and Nonveterans with less than a high school education are in small town (micropolitan) and the most rural (noncore) counties of the South. Overall, in 84% of counties, the proportion of Nonveterans is higher than the proportion of Veterans with less than a high school education.