Attention A T users. To access the menus on this page please perform the following steps.
1. Please switch auto forms mode to off.
2. Hit enter to expand a main menu option (Health, Benefits, etc).
3. To enter and activate the submenu links, hit the down arrow.
You will now be able to tab or arrow up or down through the submenu options to access/activate the submenu links.
Locator
Contact
Search
Maps

Age is 17 years and older for all maps using Veteran Population Projection model (VetPop) 2016 unless otherwise stated.
Veteran Population


By State
This map shows the number of Veterans who live in each state. Data used in this map are from the Veteran Population Projection Model (VetPop) 2016 and are current as of 9/30/2018.
This map shows the number of Veterans who live in each state. Data used in this map are from the Veteran Population Projection Model (VetPop) 2016 and are current as of 9/30/2018.

By Congressional District
This map shows the number of Veterans who live in each Congressional District. Data used in this map are from VetPop 2016 and are current as of 9/30/2018.
This map shows the number of Veterans who live in each Congressional District. Data used in this map are from VetPop 2016 and are current as of 9/30/2018.

VA Facilities by Congressional District
Organized by state, these maps depict the Veteran population using VetPop 2016 data as of 9/30/2016 and VA facilities using Veterans Affairs Site Tracking (VAST) data as of FY16Q1.
Organized by state, these maps depict the Veteran population using VetPop 2016 data as of 9/30/2016 and VA facilities using Veterans Affairs Site Tracking (VAST) data as of FY16Q1.

By County
This map shows the number of Veterans who live in each county. Data used in this map are from VetPop 2016 and are current as of 9/30/2018.
This map shows the number of Veterans who live in each county. Data used in this map are from VetPop 2016 and are current as of 9/30/2018.

65 Years and Older
This map shows the number of Veterans age 65 years and older who live in each state. Data used in this map are from VetPop 2016 and are current as of 9/30/2018.
This map shows the number of Veterans age 65 years and older who live in each state. Data used in this map are from VetPop 2016 and are current as of 9/30/2018.

Under 25 Years Old
This map shows the number of Veterans under 25 years old who live in each state. Data used in this map are from VetPop 2016 and are current as of 9/30/2018.
This map shows the number of Veterans under 25 years old who live in each state. Data used in this map are from VetPop 2016 and are current as of 9/30/2018.
Veteran Population Demographic Percentages


Percent of Veterans using VA Benefits & Services
These state web applications show the percentage of Veterans utilizing VA benefits and services. Data used in these maps are from U.S. Veterans Eligibility Trends and Statistics, 2015.
These state web applications show the percentage of Veterans utilizing VA benefits and services. Data used in these maps are from U.S. Veterans Eligibility Trends and Statistics, 2015.

Percent Change in Veteran Population by State
This map shows the percent change in Veteran population by state from 2000 to 2016. Data used in this map are from the Veteran Population Projection Model (VetPop) 2016 and are current as of 9/30/2018.
This map shows the percent change in Veteran population by state from 2000 to 2016. Data used in this map are from the Veteran Population Projection Model (VetPop) 2016 and are current as of 9/30/2018.

Percent of Veteran Population 65 Years and Older
This map shows the percent of Veterans 65 years and older who live in each state. Data used in this map are from VetPop 2016 and are current as of 9/30/2018.
This map shows the percent of Veterans 65 years and older who live in each state. Data used in this map are from VetPop 2016 and are current as of 9/30/2018.

Percent of Veteran Population Under 25 Years Old
This map shows the percent of Veterans under 25 years old who live in each state. Data used in this map are from VetPop 2016 and are current as of 9/30/2018.
This map shows the percent of Veterans under 25 years old who live in each state. Data used in this map are from VetPop 2016 and are current as of 9/30/2018.

Percent of World War II Veterans by State
This map shows the percent of World War II Veterans who live in each state. Data used in this map are from VetPop 2016 and are current as of 9/30/2018.
This map shows the percent of World War II Veterans who live in each state. Data used in this map are from VetPop 2016 and are current as of 9/30/2018.

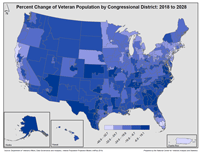
Percent Change of Veteran Population by Congressional District: 2018 to 2028
This map shows the percent of Veteran Population by Congressional District from 2018 to 2028. Data used in this map are from VetPop 2016 and are current as of 9/30/2018.
This map shows the percent of Veteran Population by Congressional District from 2018 to 2028. Data used in this map are from VetPop 2016 and are current as of 9/30/2018.
Miscellaneous


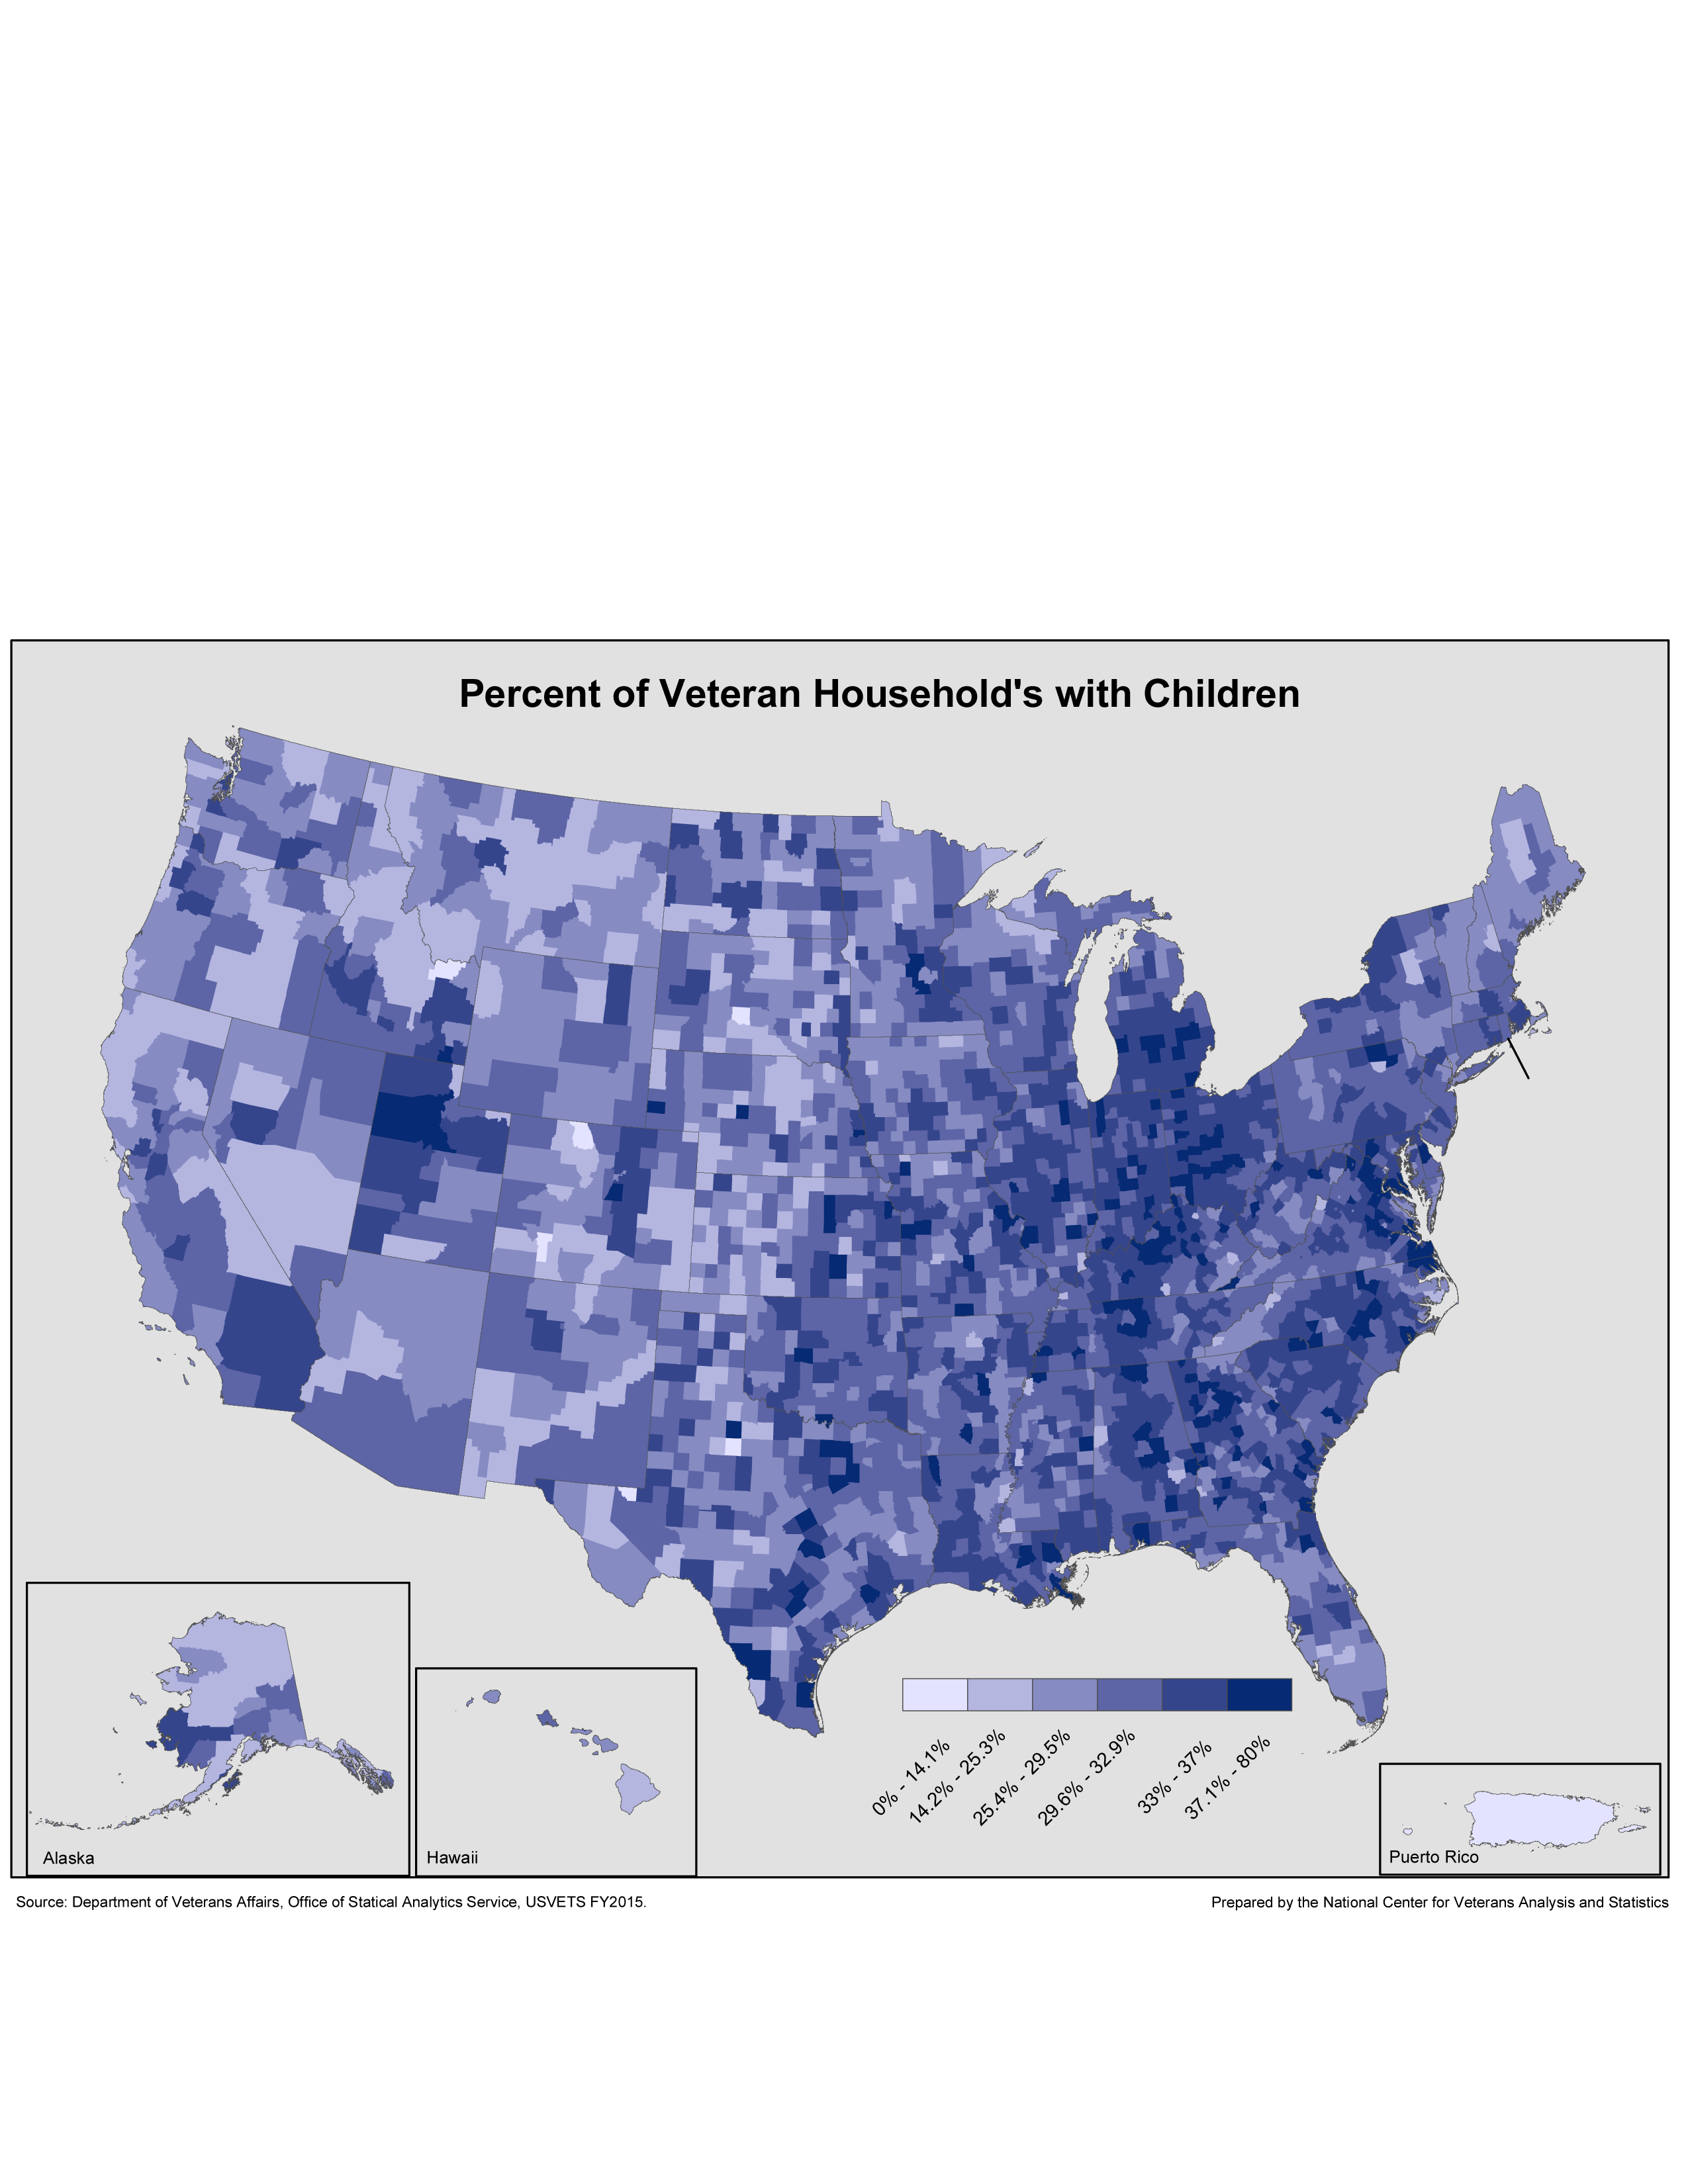
Veteran Households with Children
This map is the first time that VA has identified Veteran Households with children at the county level.
This map is the first time that VA has identified Veteran Households with children at the county level.

Federal Health Care Map
This map shows Federal health care facilities from the Departments of Defense, Health and Human Services, Homeland Security, and Veterans Affairs for the United States, Philippines, and select island areas. Data used in this map are as of 9/30/2010.
This map shows Federal health care facilities from the Departments of Defense, Health and Human Services, Homeland Security, and Veterans Affairs for the United States, Philippines, and select island areas. Data used in this map are as of 9/30/2010.

Geodatabase of VA Facilities
As of 03/31/2021 - Includes Veterans Health Administration: Medical Centers (VAMC), Community - Based Outpatient Clinics (CBOC), Community Living Centers (CLC), Domiciliary Residential Rehabilitation Treatment Program (DRRTP), Vet Centers (VCTR). Veterans Benefits Administration: Regional Offices (RO). National Cemetery Administration: National and State Cemeteries.
As of 03/31/2021 - Includes Veterans Health Administration: Medical Centers (VAMC), Community - Based Outpatient Clinics (CBOC), Community Living Centers (CLC), Domiciliary Residential Rehabilitation Treatment Program (DRRTP), Vet Centers (VCTR). Veterans Benefits Administration: Regional Offices (RO). National Cemetery Administration: National and State Cemeteries.
What’s New!
Note: You may need to visit the VA Viewer Software page to view the documents available on this page. To download any of the tables on this page, right click on the associated link and select “Save Target As.” Then, save the document to the location of your choice.


